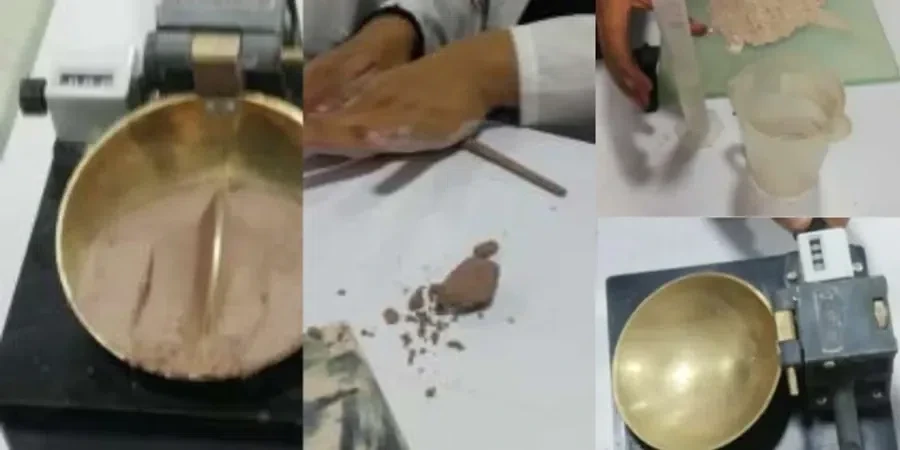
The brass cup drops. One, two, three taps per second on the hard rubber base until the groove closes at exactly 25 blows. That's the Casagrande device running in our Murfreesboro lab, and it's the starting point for every Atterberg limits determination we perform. Middle Tennessee clays, particularly the residual soils derived from Ordovician limestone, behave differently than the loess deposits out west in Memphis. We see it daily. A sample from the Blackman area with 72% fines can shift from stiff to plastic with just a few percent moisture change. Before you pour a footing near Stones River or grade a pad in the Gateway district, knowing the liquid limit, plastic limit, and plasticity index isn't optional—it tells you exactly how the soil will react to seasonal wetting and drying cycles. Our grain-size analysis often runs in parallel with Atterberg testing because the two together classify the soil per ASTM D2487 USCS.
If the plasticity index exceeds 20 in Murfreesboro residual clay, you're looking at a soil that will move—seasonally, predictably, and enough to crack unreinforced slabs.
Area-specific notes
IBC 2021 Section 1803.5.3 requires soil classification for foundation design in expansive soil regions, and Rutherford County sits squarely on the Highland Rim physiographic province with documented expansive clay units. The USDA Soil Survey for Rutherford County maps the Mimosa and Talbott series extensively across Murfreesboro—both are silty clays with moderate to high shrink-swell potential. A foundation designed without Atterberg data in these soil units risks differential heave that can rack door frames, crack brick veneer, and shear plumbing connections. The 2010 flooding event along the West Fork Stones River saturated these clays to depth, and properties with poor drainage saw movement for months afterward. Knowing the liquid limit relative to the in-situ moisture content gives us the liquidity index, which directly relates to sensitivity and remolded strength. This isn't academic—it's the difference between a slab that lasts 30 years and one that fails in five.
Q&A
What do Atterberg limits tell me about Murfreesboro soil?
They define the moisture contents where fine-grained soil transitions between solid, semi-solid, plastic, and liquid states. Liquid limit marks the boundary from plastic to liquid. Plastic limit marks the boundary from semi-solid to plastic. The plasticity index (LL minus PL) quantifies the moisture range where the soil behaves plastically. High PI clays common in Murfreesboro indicate high shrink-swell potential and low bearing capacity when wet.
How much does Atterberg limits testing cost in Murfreesboro?
Standard Atterberg limits (liquid limit plus plastic limit) run between US$70 and US$90 per sample. Combined packages with grain size analysis are priced separately. Volume discounts apply for five or more samples from the same project.
How long does the test take from sample to report?
Standard turnaround is 48 hours from sample receipt to report. We can expedite to same-day results if samples arrive before 9:00 AM. The limiting step is oven-drying, which takes 16 hours minimum per ASTM D4318.
What sample size do you need for Atterberg testing?
We need roughly 300 grams of material passing the No. 40 sieve. From a bag sample, send about 1 kg of representative soil so we have enough to split, dry, and process. The material must be from the specific stratum of interest—not a mixed bulk sample.
Do you run Atterberg limits on the minus No. 200 fraction like some labs?
No. ASTM D4318 specifies the minus No. 40 (425-micron) fraction, and that's what we follow. Running it on the minus No. 200 fraction gives artificially low liquid limit values and misclassifies the soil. We've had to re-test samples from other labs that made this mistake on Murfreesboro projects.