Seismic design in the New Madrid Seismic Zone demands a rigorous understanding of subsurface behavior that generic reports from outside the region often oversimplify. The International Building Code (IBC) and ASCE 7-22 require a site-specific soil liquefaction analysis when Site Class F soils are encountered or when the mapped spectral accelerations exceed defined thresholds — conditions that exist across parts of Rutherford County where saturated alluvial deposits and loose granular fills sit beneath a shallow water table. Murfreesboro sits roughly 180 miles east of the New Madrid fault system, a distance that does not eliminate the risk of long-period ground motion amplification in soft soils.
Our approach integrates corrected SPT blow counts (ASTM D1586-18) or CPT tip resistance (ASTM D5778) with the simplified procedure refined by Idriss & Boulanger (2014), computing the Cyclic Stress Ratio (CSR) demanded by the design earthquake and comparing it to the Cyclic Resistance Ratio (CRR) of each potentially liquefiable stratum. The result is a Factor of Safety against triggering for every foot of the profile, not just a binary yes/no verdict. When clients need to understand how the results inform foundation selection, we connect the liquefaction analysis directly to deep foundations design parameters that account for loss of skin friction through liquefied zones.
Liquefaction analysis is not a pass/fail box to check — it is a settlement and lateral displacement forecast that drives foundation decisions and Improvement budgets.
Scope of work
In Murfreesboro, we often see geotechnical reports that apply a single SPT-based chart without adjusting for the low-plasticity silts common in the Stones River floodplain — a shortcut that can produce misleading CRR values. The fines content and plasticity index of these soils shift the CRR curve, and ignoring that nuance either overestimates risk and drives unnecessary deep foundation costs, or underestimates it and leaves a project exposed. Our laboratory runs parallel grain-size distributions (ASTM D6913/D7928) and Atterberg limits (ASTM D4318-17) on every sample from the critical depth horizon to feed the correct fines correction into the Idriss-Boulanger trigger curve.
Beyond triggering, the analysis quantifies post-liquefaction volumetric strain using the Ishihara-Yoshimine procedure calibrated to relative density, producing settlement estimates that structural engineers can use directly in their differential settlement models. We also evaluate lateral spreading displacement where a free face or gently sloping ground exists within the site geometry, applying the Youd et al. (2002) empirical model or site-specific Newmark sliding-block analysis when warranted by the project complexity. The deliverable includes a Liquefaction Potential Index (LPI) map that highlights the spatial variation of severity across the building footprint, giving the design team a clear picture of where Improvement or foundation stiffening is most needed.
Area-specific notes
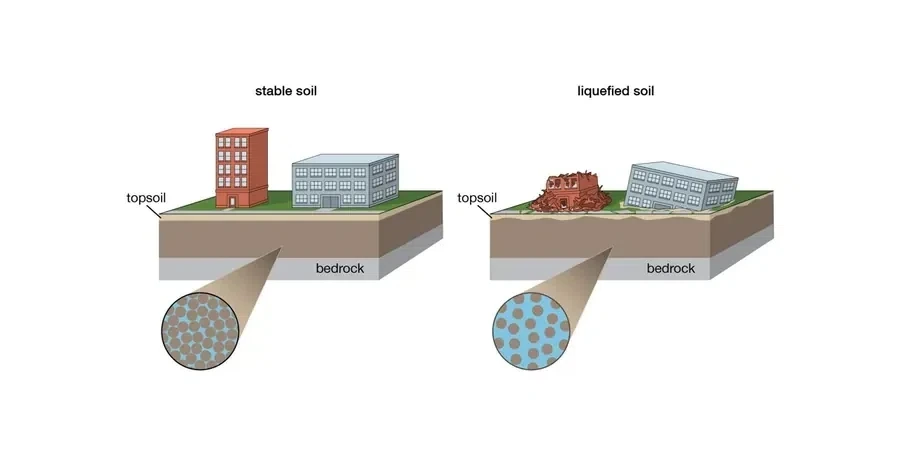
The surficial geology beneath much of Murfreesboro includes Quaternary alluvium mantling the Ordovician limestone — a sequence where loose to medium-dense sands and low-plasticity silts accumulate in paleochannels that are not always mapped on county-scale geologic quadrangles. When the groundwater table sits within 15 feet of the surface, as it commonly does along the West Fork Stones River corridor and its tributaries, a seismic event generating even 0.10g to 0.15g PGA can trigger excess pore pressure accumulation in these saturated granular layers. The consequence is not necessarily catastrophic bearing failure, but rather a few inches of differential settlement that can shear utility connections, crack slab-on-grade floors, and impose unanticipated moments on pile caps.
A second hazard that local practitioners sometimes overlook is the cyclic softening of sensitive silts — a distinct failure mode from sand liquefaction that can produce significant strength loss at strain levels below what a standard SPT trigger analysis captures. When the project site includes fill placed over alluvium without documented compaction records, we recommend a site-specific response analysis that models pore pressure generation and dissipation throughout the shaking duration, rather than relying solely on the simplified empirical procedure. This level of analysis becomes particularly relevant for Risk Category III and IV structures that cannot afford post-earthquake downtime.
Standards used
ASCE 7-22 — Minimum Design Loads and Associated Criteria for Buildings and Other Structures, IBC 2021/2024 — International Building Code, Chapter 18 (Soils and Foundations), ASTM D1586-18 — Standard Test Method for Standard Penetration Test (SPT) and Split-Barrel Sampling of Soils, ASTM D5778-20 — Standard Test Method for Electronic Friction Cone and Piezocone Penetration Testing of Soils, ASTM D2487-17e1 — Standard Practice for Classification of Soils for Engineering Purposes (Unified Soil Classification System), NCEER/NSF (1997/2001) — Summary of the Workshop on Evaluation of Liquefaction Resistance of Soils
Q&A
At what depth do you typically stop the liquefaction analysis for a Murfreesboro site?
We evaluate all potentially liquefiable soils within the upper 50 feet of the profile, which is the standard depth range covered by the simplified procedure. In practice, most liquefaction-susceptible alluvium in the Murfreesboro area is encountered within the upper 30 to 40 feet below grade, but we extend the analysis deeper if loose granular strata or a high groundwater condition persist. For sites with deep fills or complex paleochannel stratigraphy, we may recommend extending investigation depths beyond 50 feet and running a site-specific response analysis rather than relying solely on the simplified trigger curves.
How long does a full liquefaction analysis take from field work to final report?
For a typical commercial building footprint with SPT data already available, the analysis and reporting can be completed within 10 to 12 business days. If our team performs the drilling and laboratory testing — which includes grain-size distributions, Atterberg limits, and fines-content determinations — the total turnaround is usually three to four weeks. CPT-based projects move faster on the field data collection side but require additional processing time for Ic-based soil classification and continuous CRR computation.
What does a soil liquefaction analysis cost for a project in Murfreesboro?
The cost for a site-specific liquefaction triggering and settlement analysis in the Murfreesboro area generally ranges from US$2,740 to US$4,540, depending on the number of borings or CPT soundings included, the depth of the liquefiable profile, and whether lateral spreading displacement modeling is required. Projects that need a full ground-motion response analysis with pore pressure generation modeling fall at the upper end of this range or may exceed it depending on the complexity of the site geology.
Do you include the liquefaction analysis directly in the geotechnical report or is it a standalone document?
We deliver the liquefaction analysis as a self-contained appendix within the full geotechnical investigation report, which means the structural engineer receives the Factor of Safety logs, LPI map, settlement profile, and lateral spread estimates in a format that can be cross-referenced directly with the foundation recommendations chapter. This integrated approach avoids the disconnect that occurs when a specialty consultant prepares a standalone liquefaction memo that the geotechnical engineer of record then has to reinterpret for their own report.